Spatial Profiling Viewer
Single cell spatial transcriptomics is an emerging technology enabling the quantification of location-aware genomic profiles from biology tissues. It offers the potential to answer important biological questions. For example, how the tens of thousands of single cells spatially interact in the brain, liver or kidney, and how the cells differentiated into different clusters but cooperates to fulfill certain biological functions. To accompany to the rapid development of the technology and facilitate interpretation of biological questions, we present a standalone tool, Spatial Profiling Viewer (SpaCeV), to visualize and analyze wide-range of single cell spatial transcriptomics datasets. The software requires plain input data: the cells Cartesian coordinates and cell types. It offers four categories of functions: (1) spatially laying out up to 100,000 cells in user’s desktop, and allowing zooming and panning in real time; (2) visualizing the spatial distribution of cell types based on statistical smoothing methods so that the fine-structure of tissue can be easily revealed; (3) analyzing a user specified region of interests (ROI) and quantitatively measuring the interactions among differential cell types; (4) comparing two ROIs and statistically comparing the strength of cell interactions.
Check more
Sprod: De-noising Spatially Resolved Transcriptomics Data Based on Position and Image Information
Spatial Resolved Transcriptomics (SRT) techniques provide gene expression close to or even superior to single cell resolution, while retaining the physical locations of sequencing and sometimes also provide matched pathological images. However, the expression data captured by SRT techniques suffer from severe inaccuracies, including but not limited to drop-outs as in regular single cell RNA-sequencing (scRNA-seq) data. To reduce the level of noise in the data, we developped the Sprod tool, which incorporated image information and spot/bead positional information and used latent graph modeling to impute the gene expression data of each spot/bead.
Check more
pMTnet
Deep learning neural network prediction tcr binding specificity to peptide and HLA based on peptide sequences. Please refer to our paper for more details: "Deep learning-based prediction of T cell receptor-antigen binding specificity."(https://www.nature.com/articles/s42256-021-00383-2) Lu, T., Zhang, Z., Zhu, J. et al. 2021.
Check more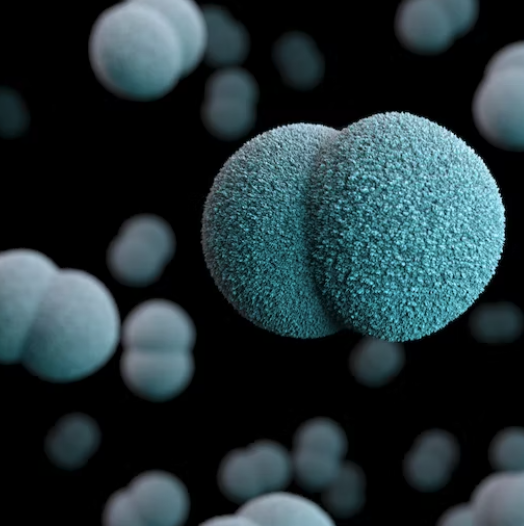
IntegrativeBayes
Microbiome omics approaches can reveal intriguing relationships between the human microbiome and certain disease states. Along with identification of specific bacteria taxa associated with diseases, recent scientific advancements provide mounting evidence that metabolism, genetics, and environmental factors can all modulate these microbial effects. However, the current methods for integrating microbiome data and other covariates are severely lacking. Hence, we present an integrative Bayesian zero-inflated negative binomial regression model that can both distinguish differentially abundant taxa with distinct phenotypes and quantify covariate-taxa effects. Our model demonstrates good performance using simulated data. Furthermore, we successfully integrated microbiome taxonomies and metabolomics in two real microbiome datasets to provide biologically interpretable findings. In all, we proposed a novel integrative Bayesian regression model that features bacterial differential abundance analysis and microbiome-covariate effects quantifications, which makes it suitable for general microbiome studies.
Check more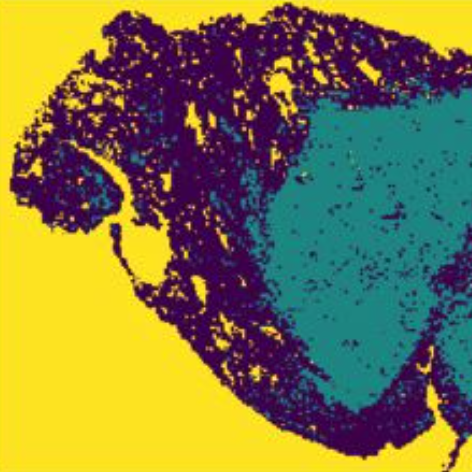
Comprehensive analysis of lung cancer pathology images
Scripts for https://www.nature.com/articles/s41598-018-27707-4, Comprehensive analysis of lung cancer pathology images to discover tumor shape and boundary features that predict survival outcome.
Check more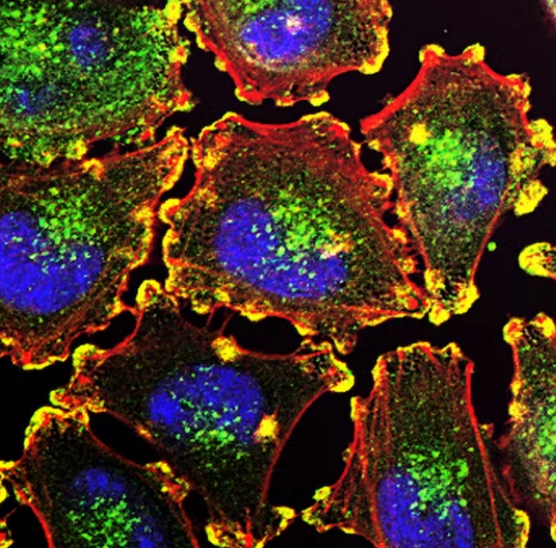
The QBRC somatic mutation calling pipeline
The QBRC mutation calling pipeline is a flexible and comprehensive pipeline for mutation calling that has glued together a lot of commonly used software and data processing steps for mutation calling. The mutation calling software include: sambamba, speedseq, varscan, shimmer, strelka, manta, lofreq_tar. It identifies somatic and germline variants from whole exome sequencing (WXS), RNA sequencing and deep sequencing data. It can be used for human, PDX, and mouse data (fastq files or bam files as input). Please refer to the lab website of Dr. Tao Wang, https://qbrc.swmed.edu/labs/wanglab/index.php, for more information.
Check more
Cytomulate: Accurate and Efficient Simulation of CyTOF data
Cytomulate is a package to simulation realistic data for Mass Cytometry or Cytometry by Time-of-Flight (CyTOF). We support both model-based through Creation Mode and real-data-based simulation through Emulation Mode. Cytomulate serves as solutions to benchmarking, method validation, prototyping, and more. You can easily generate realistic and accurately CyTOF simulations within seconds.
Check more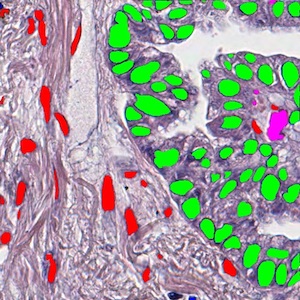
MaskRCNN
Mask Regional Convolutional Neural Network (Mask-RCNN) is a newly developed deep-learning algorithm. We trained a Mask-RCNN model to segment tumor nuclei, stroma nuclei, lymphocyte nuclei, macrophage nuclei, karyorrhexis, and red blood cells in pathological Hematoxylin & Eosin (HE) stained images. Around 10,000 cells are covered in our training dataset from the National Lung Screening Trial (NLST) cohort. This tool aims to dissect tumor microenvironment in cell level.
Check more
MiCoDe
Microbiomes harbor intricate associative connections, or co-occurrence, between member taxa that may be critical to the assembly and function of the microbial community. Identifying and characterizing these associations from metagenomic data may offer informative insight into disease progression and prevention. The organization of the microbiome is thought to be a singular assortative network, where interactions between taxa can readily be clustered into segregated and distinct communities. However, identifying distinct communities from microbiome data remains challenging. Microbiome community detector (MiCoDe) is a web tool that fits a weighted stochastic block model (WSBM) to a network edge-weight matrix to study the community structure of co-occurrence networks derived from metagenomic data.
Check more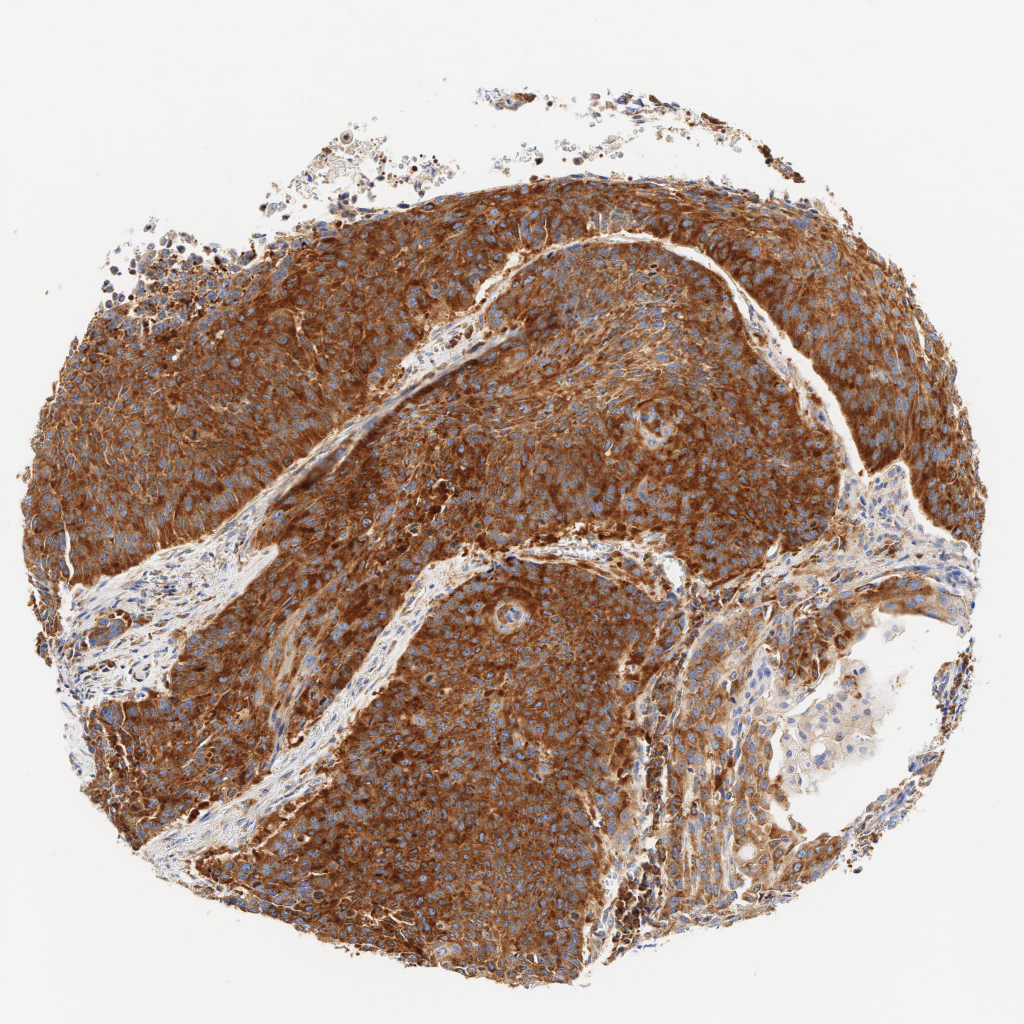
Automatic H-score Quantification (AHSQ)
AHSQ is a deep learning-based computational algorithm to quantify the H-score of immunohistochemistry (IHC) images. It starts with color deconvolution of the original IHC image to separate hematoxylin staining and DAB staining. Based only on hematoxylin staining, our trained UNet-MobileNet model is used for region recognition, and basic image processing methods are used for nuclei segmentation. By combining the mask for the target cell region and the mask for nuclei, the nuclear region and the cytoplasmic region of the target cells are identified respectively, and one of them is regarded as the target area for H-score quantification. The DAB staining of each pixel within the target area is classified as negative staining, weak staining, moderate staining or strong staining according to the predefined thresholds. The final H-score is calculated as a weighted average of the percentages of weak staining (weight = 1), moderate staining (weight = 2) and strong staining (weight = 3) within the target area. In sum, this algorithm can take an IHC image as input and directly output the H-score within a few seconds, which drastically speeds up the whole IHC image analysis procedure.
Check more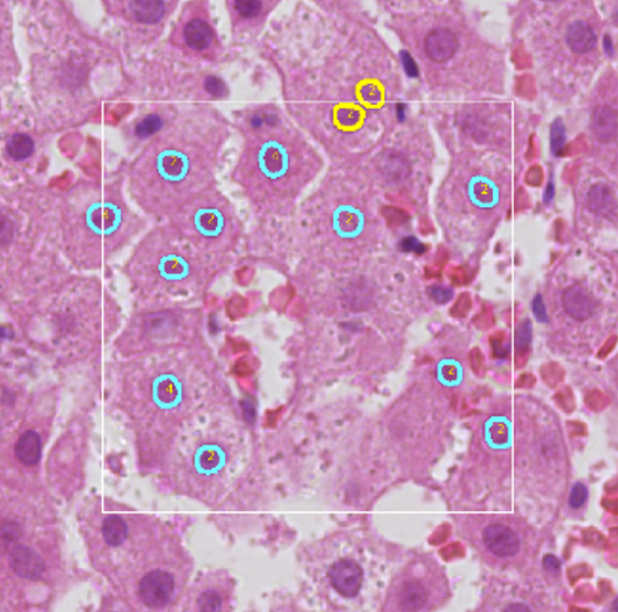
ICPQ
ICPQ (IMAGE-BASED CELL PLOIDY QUANTIFICATION) is a deep learning-based computational algorithm to characterize and quantify hepatic ploidy for individual patients. To make the whole analysis procedure more accessible for clinical samples, the algorithm can quantify ploidy information using hematoxylin-eosin (H&E) histopathology images. A deep learning model was trained to segment and classify different types of nuclei on H&E histopathology images. Based on the identified hepatocyte nuclei, both cellular and nuclear ploidy are calculated. Using this algorithm, we can establish the total number of hepatocytes and detailed ploidy of each hepatocyte in the region of interest (ROI).
Check more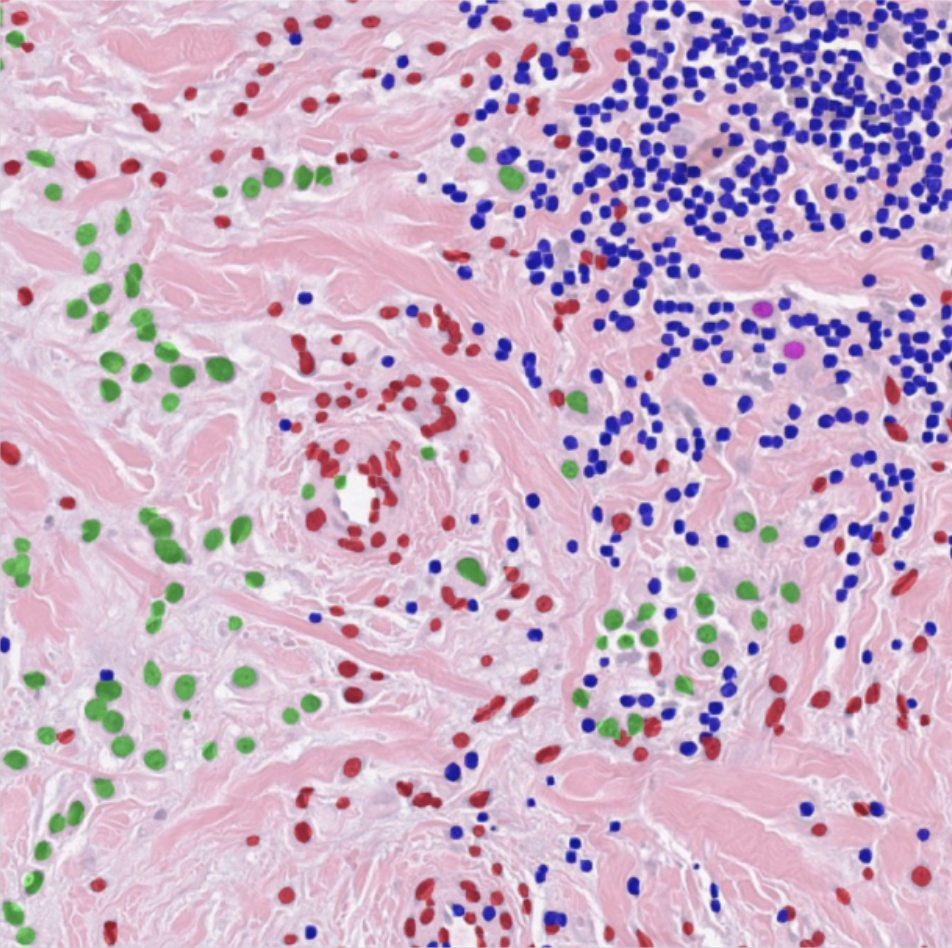
HD-staining v2
The HD-Staining-v2 system utilize the latest one-stage detection algorithms YOLO to dramatically enhance the nuclei detection and segmentation speed. The new system is 15 times faster than HD-Staining-v1 with improved accuracy and precision. Whole slide imaging analysis reveals the blazing fast speed of the v2 system that can potentially reduce the workloads from weeks to hours.
Check more